Share It

Share |

Thursday, October 21, 2010

A Warning Sign for the Euro Bulls

The rise up of the Euro against the Dollar has been in place for the last months. Now the time for a change may be near. Take a look at the daily EUR/USD graph (click on it to see it big):

Here we have a bit of a worring picture. The value of Euro has continued to rise despite the MACD recorded lower values. The Stochastic followed the MACD but still the MAs are on the positive side. That explains the volatile movements we are seeing these days. The Stochastic is pointing forward and the Euro rose again today. So far. The formation which is about to be formed is very worrisome for the Euro as there is a chance the power of the Euro Bulls that drives the increase of its value toward the Dollar to be vanishing.

The weekly graph still shows the Euro may has some time to go up but the Stochastic points it to be a bit overbought.

The more important warning sign is on the Monthly EURO/USD graph shown below:

Here the MAs are still not on a positive side but still the Euro has risen a lot for the past months. What lights the red lamp is the Stochastic value which show the Dollar might be oversold. If that proves to be true we might witness another major rise of the Dollar in the next months. The situations requires attention and the conclusions might vary depending on the real data.

Friday, August 27, 2010

Current expectations for September, 2010

Expectations in short for September -
Dollar - down
Gold - down
Stock markets - up


Today the FED again has reassured the markets it will continue its monetary policy of easy money in order to stimulate consumer spending and get US out of the trap. This alone will give enough  strength of the Euro to continue its advance as there will be expectations of increasing the amount of available Dollars on the market. The weaker Dollar will give more competitive strength to US companies and further improve their financial results. As a secondary effect the Crude oil value could increase.

On the other hand such stimulus money (or any other type of government support) would give markets the long awaited trigger to start trading positive expectations again.

As markets turn positive using Gold as a hedging vehicle would become less popular. Having a big enough drop in demand of Gold would pretty much turn the tide. A considerable drop in Gold price would scare most of the last crowd that entered the Gold market in hope to make some quick profits which would increase the selling pressure further.

All these are an expression of an analytic point of view. Will wait for the end of September to compare with the real data.

Thursday, July 29, 2010

Euro/Dollar (EUR/USD) Technical Analysis - Daily, July 29, 2010

The Euro/Dollar pair was in quite an uptrend for the last weeks. The graphs however show this could be close to an end. We examined the weekly graph in our weekly technical analisys and now the Daily one looks promising.

The Daily Euro/Dollar graph (click on it for a better view) shows the pair was making new highs for the last several weeks while the MACD continued to make lower highs. Now its even on the negative side. The Stochastic shows the Euro is now in the overbought area.
The bearish MACD divergence combined with the overbought condition could trigger pretty soon selling of the Euro after all the buying power gets too exhausted.

A possible trigger for such a movement could be any of the news expected today - the Unemployment change in Germany, the Economic confidence in EU, M4 Money supply in UK or the Jobless claims in USA. One may follow these news (and even more) in our Economic calendar .

Tuesday, July 27, 2010

Euro/Dollar (EUR/USD) Technical Analysis - Weekly, 31 week, 2010

It's been a while since our last technical analysis of the Euro/Dollar currency pair. The Euro continued its upward movement supported by the strong oversold conditions of the previous months. Now it trades around 1.298/1.30 where the 61.8 Fibonacci retracement level lays. On the daily graph we see a continuing upward movement of the pair price for the last 2-3 weeks while the indicators continue to make lower highs.

The weekly graph of the Euro/Dollar pair (click on it for a better view) presents an interesting situation. MACD is on positive side while the MAs are still negative. The Stochastic is in overbought area. And the price of the Euro is at the 61.8 Fibonacci level. A fail to penetrate this level could result in another upward movement of the Dollar. The bearish divergence seen on the daily graph supports the idea that the current resistance level would sustain and another fall of the Euro could be on its way. For a clearer view we might look at the monthly graph below.

On the monthly graph we see the major trend is still up for the Dollar and down for the Euro. The Stochastic is signaling an increase of the Euro value which took place during the current month. Still the major trend is not changed and having in mind the weekly and daily graphs another fall of the Euro towards the 1.19/1.20 levels is possible soon.

Monday, June 28, 2010

Euro/Dollar (EUR/USD) Technical Analysis - Weekly, 27 week, 2010

The expected upward movement for the Euro toward the US Dollar took place in previous weeks. While at first the Euro fell to about 1.19 then it advanced quickly to above 1.24 touching the 1.2460/70 area. After that the power of the Euro bulls started to vanish and it lost about 2 cents.
This week starts with an advance of the Euro again and now it trades near 1.24 level again. The weekly graph (click on it for a better view) however hardly supports a lasting increase of the Euro value against the US Dollar.

The Euro went to the MA level and the Stochastic is continuing to climb to the overbought areas. Still however, it is not there so we might witness a test or even a break of the previous high at 1.247 level. The next resistance lays at the 38.2 Fibonacci level which means it would trade around 1.256 Dollars. Still the MAs on the weekly graph are too far from each other and the possibility for another fall of the Euro to around the 1.2/1.19 level is valid.
The trading during the week could be a very volatile one because the Euro/Dollar pair is at marginal levels. Plus the end of the month is near which would form the view on the monthly graph.

The important news from the markets concerning the EUR/USD currency pair in the week ahead are the Consumer Price index in Germany (to be released on Monday), the Money supply levels in EMU zone and UK (due Monday and Tuesday), Personal income and Consumption in USA (to be released on Monday), Consumer confidence in EU and USA, Unemployment rate in Germany (Wednesday) and in EMU and USA (Friday), Gross Domestic Product of UK (Wednesday), Jobless claims in USA (Thursday).

Wednesday, June 9, 2010

US stock market short-term update - technical, S&P 500, 09062010

The futures trading shows some of the strength of the bulls might be vanishing so one should beware.

What is formed on the 4 hour graph is a hidden divergence between the S&P 500 (SPX) index and the Stochastic indicator which could signal a retreat for the index at least in short term. There are several hours to pass before the opening of the market so these could be bears' hours.
On the smaller time-frame graphs the down direction is even more visible. On the 1 hour and 30 min there is still more time to pass before the down movement is finished.

US stock market technical analysis - S&P 500, daily, 09062010

US stock market has fallen a lot. What started as a surprise to many of the players at the beginning of May continued during the whole month and now the S&P 500 index has reached one of its lowest levels for the period. The signs of the current fall were visible even in April when a series of bearish divergences were formed on the daily and weekly graphs and our expectations of a fall of the markets proved to be right. That downfall was striking to many people and now as they have fresh memories of the pains they might have taken during last 3 years, they are now more scared than ever. Suddenly almost everybody turned bearish which explains the striking volatility and sharp downfalls of the indices. But this means also one more thing - there could not be much more fuel to the inertia. And the rising of the markets could surprise at least as many people as did the sudden decrease of the indices. So much for the psychology. :)

What we see today on the daily graph might pretty much mean the bulls might take some control now.

The graph shows the index continues to make new lows but the indicators don't follow. For today the S&P 500 grew and the Stochastic shows it being in an oversold condition. Still the MAs show the index is in a negative area but those divergences could lead to an increase. Still for a long-term bullish view, this bullish divergence better be confirmed by the MAs crossing on the upside.
The weekly graph shows the index is in a downtrend but a warning sign for the bears (and a good news to the few bulls) is that on the monthly graph the index still hasn't crossed that line and is in an uptrend. There is also no MACD bearish divergence there.


Despite the uncertainty if the index will change its down trend now for the long term, the 4 hour graph shows that for tomorrow there's a big chance the increase to continue. What we see here is the bullish divergence is seen in two indicators which could definitely lead to a continuation of the increase. Around 1068-72 level could be some resistance and if that gets broken, the way up to 1100 seems open.

Thursday, June 3, 2010

Euro/Dollar (EUR/USD) Analysis - Monthly, June, 2010

Last month the Dollar made one of its biggest gains in a month against the Euro. The trading began at May, 1st at around 1.33 and closed the month at 1.2286 with 1.2140/30 being the lowest level reached. This made almost 7.6% gain for the Dollar.

As was supposed in the current weekly technical analysis, June started with a test of the lowest level around 1.214 which was penetrated a bit to 1.2110 and a bounce followed. Now the Euro trades below its previous support level around 1.23.

The monthly graphs shows we are in a Dollar area and the Euro is deeply oversold. A warning sign for any Euro bulls would be the MACD whose histogram continues to dig deeper on the negative side.

As the support level at 1.23 was broken last month the next one (which is a major strong support) lays around 1.17/1.19 area. If the inertia from the last month proves to be strong enough, this is a possible target to reach.

Looking on the Weekly and Daily graphs we could see some signs for an upward Euro movement but even if it appears during the month, the overall trend is still negative for the Euro.

One should keep in mind that there is a possibility for a strong bullish divergence for the Euro to be formed on the monthly graph and if that happens it could signal a long (possibly years) upward trend for the Euro against the US Dollar. Still as we are looking at a very big time-frame graph it could take 1-2 months before such a divergence to appear clearly.

Monday, May 31, 2010

Euro/Dollar (EUR/USD) Technical Analysis - Weekly, 23 week, 2010

Hello. Let's take a look at the possible scenarios for the week ahead concerning the Euro/Dollar trading.

 The weekly graph points to possible bullish divergences for the Euro which could signal the trend reversal is near. The main problem with these divergences however is that they are not finished yet. This could lead to many people getting hurt by expecting a strong upward Euro movement while it still hasn't found a strong enough momentum. A classical case for a bull's trap. This could trigger a wave of stops being hit which presents a big opportunity for a test of the previous lows of the Euro around 1.21.
The daily graph also raises some warning signs which basically consist of the fact that even with positive MACD histogram and being in a relatively oversold position, the Euro is still not able to advance high enough (above 1.25-1.26) and to sustain that level.

With all that said it would be good to keep in mind that the mentioned divergences could get formed in the near future (maybe even next week) and an explosive upward move of the Euro against the US Dollar is highly possible.

Thursday, May 27, 2010

Gold fever. Will its price fall?

For the last year Gold has attracted much of attention. There are numbers spoken in the range of 1500 to 5-7000 and rumors of bets in those areas. The notion is that if this is spoken of, it might happen. So everybody rushes in and tries to get a share in the profits. It's like people expect and believe the market is just and it is its duty to give them what they need. The sad truth is, to paraphrase what Mark Twain once said, that the market owes you nothing because it was here first.

Gold price might continue to rise. If the demand exceeds the supply this would be normal. Even if the trading never gets to deliver real bullion the price would still be a question of demand and supply. The only difference would be the leverage that is possible to be used when trading not in real bullion. The amount of that leverage however could vastly increase the available amount of money that could be poured into Gold and effectively to create a pump&dump structure similar to the credit bubble and the housing ones. These however, are only assumptions and possible future scenarios. Nothing is sure in markets.

Let's take a look at the historical movement of Gold compared to the movement of Euro/Dollar pair. As these are past numbers we could use them to make some notes or even conclusions.

Table 1. Changes in price of Gold and the value of US Dollar against the Euro

 1995-20012001-20082008-2008.102008.11-2009.112009.11-2010.05
Gold- 39%284%- 41%73%5%
EUR/USD- 39%80%- 29%22%- 20%

This comparison draws some interesting ideas.

The first one is that in general for the last 15 years Gold and Dollar were negatively correlated and the Euro and Gold were positively correlated. This means that whenever the Dollar rose in value against the Euro the price of Gold fell. This happens to be true till the last period which starts around the end of last year (November 2009) and continues till now. During this last period at first there is a slight fall of the Gold price in accordance with the rising value of the US Dollar but shortly after the Gold continues to rise and now Gold and Dollar seem to have broken its previous type of correlation as the value of Gold was increased by 5% for the period accompanied by a 20% rising of the Dollar.

In the light of the last market turmoil this could mean a lot more people could be using Gold as a hedge against a possible economic downturn. Or at least these people (or orders) entered the market in the last several months and were enough to break the previous type of negative correlation that was in place.

A second thing of note on the table above is the value of the correlation. Before 2001 the table shows the value was pure -1 which means there is a great possibility that the value of Gold was calculated in the "buying power" of the US Dollar. Thus every drop in the US Dollar drove the Gold price higher in the same proportion and vice versa. After year 2001 this doesn't seem to be the case.

During the later periods the negative correlation was still in place but it's power was changing. The proportion of movements (or say it Beta if you'd like) changed from pure -1 to more distorted values. For the next period the price of Gold rose 3.55 more that the value of the Dollar fell. With all other conditions equal this could mean there was a 3.55 times more demand for Gold than in the previous period. Such an increase in real demand looks a bit striking but having in mind the construction and debt bubbles all over the world in that period makes it not so impossible. The next periods just continue to distort the strong negative connection between the Dollar value and the Gold price. Thus we come to the last period in which the Gold price and the Dollar started to move in the same direction in contrast to all the previous periods in the table.

An interesting thing about the beginning of the century is that in the years of 1990-2001 the electronic means of trading became widely available. And then after year 2001 there came the CFDs to their fullest. This marked the era of the easy access to the market and eliminated the need to really own the shares (or commodities!) you trade in on leverage. With CFDs the leverage could go up to 1/100 or even 1/500. So a person with $1000 could have a buying power of $100000. This increased amount of available money could explain the bigger proportions between the movements of Gold and US Dollar during the period after year 2001. As the CFDs are not available to US investors this could mean that the world outside the US could be the reason for the changing the proportion.

Generally the price of Gold was affected by the value of the Dollar which happened to be lower in times of economic strength and growth and higher in troubled times. The higher value of Dollar when there are troubles in stock markets is possibly because the Dollar is perceived as a save-haven currency. I believe there is a chance the next recovery will be also accompanied by a weaker Dollar as this will help the US economy. So if the current newly found state of positive correlation between Gold and Dollar prices is preserved, this would mean the Gold could fall accordingly.

The last upside in the Gold price despite the rising Dollar and in the light of Europe's debt problems speaks that it could be mostly used as a hedge instrument now. Apart from the fact that using as a hedge something you own only on paper and not "holding in your hands" devalues the idea of hedge itself, using Gold as a hedging means that when there is no need to hedge a imminent danger, there would be no need to hold Gold.

All the above thoughts lead me to a conclusion that when times get calmer and the horizons look brighter the Gold price could fall. Even just in order to compensate the change in the correlation that appeared during the current crisis. There are technical signs that such a move could not be so much ahead in time but this would be a topic of another article.

Wednesday, May 26, 2010

Euro/Dollar (EUR/USD) Technical Analysis - Daily, May 26, 2010

After yesterday's closing of the Euro/Dollar pair near to its open level, today's trade started lower. However the technical analysis shows the direction might change during the day.

The daily graph of EUR/USD (click on it for a better view) shows the Euro gets close to being oversold while the MACD histogram is positive. Still the Stochastic points down but the formation looks promising for an Euro advance. Let's check the lower time-frame graphs.

On the 1 hour graph of Euro/Dollar we see the pair is swinging around the Moving Averages. Still the MAs are positive and the Stochastic points strongly upward. This could lead to at least a short term advance of the Euro against the US Dollar with target placed at the previous high around 1.2380/90.

The overall risk of further decline of the Euro still stays on the bigger time-frame graphs.

Tuesday, May 25, 2010

Euro/Dollar (EUR/USD) Technical Analysis - Weekly, 22 week, 2010

The Euro/Dollar pair took again the major trend direction this week. After the increase of the Euro for the last week which was partly supported by the weekly and the daily graph, now it's again on the downside. During the weekend the news that a major Spanish bank - the Roman Catholic Church-controlled savings bank CajaSur, was took over by the central bank of Spain hit the Euro and made it fall on two consecutive days. Now it trades around 1.2230/40 against the US Dollar.

The weekly Euro/Dollar graph (click on it for a better view) doesn't show any strong upside support for the Euro. Both MACD and Stochastic are pointing down. Such movement could continue at least till Stochastic shows the Euro is too oversold. The current market sentiment is negative towards the Euro and every news about even potential problems in the EU zone could trigger further selling.
There are market rumors on possible ECB intervention but one shouldn't count on that as such a move is mostly hypothetical. However the more oversold the Euro gets, the higher becomes the possibility of volatile movements and explosive ups and downs. The reasons for such movements could be different and could include a possible intervention - either by decreasing the amount of Euros available on the market or by increasing the amount of Dollars.

Thursday, May 20, 2010

Euro/Dollar (EUR/USD) Technical Analysis - Daily, May 20, 2010

Today's technical analysis of Euro/Dollar pair lead us to an interesting conclusion.

On the daily graph (click on it for a better view) of Euro/Dollar pair we see a bullish movement for the Euro. This explains the upward movement for the last two days. A possible target could be around 1.25 where the MA and several Fibonacci levels are found.

Still the smaller time-frame graphs suggest in a shorter term there could be a pull back of the Euro.
The 4 hour graphs still has some time to go up but on the others there are severe bearish divergences seen.
On the 1 hour graph we see the Euro tries to get higher but obviously it's loosing its strength. The Stochastic is in its highest levels but still the MACD is almost negative. Should this divergence takes the lead we could see another drop of the Euro at least around the levels it floated during the Asian trading day - 1.2320/30.
Having in mind the fragile Euro sentiment this could be easily broken and another fall below 1.23 could be seen.

Wednesday, May 19, 2010

US stock market technical analysis - S&P 500, daily, 18052010

The US markets have fallen a lot since the last technical analysis. Today the US Consumer Price Index (CPI) level is expected to be announced. The consensus figures are 0.1 (MoM) and 2.4 (YoY). Earlier in the day the Construction Output in the European Monetary Union (EMU) was declared to be 7.6% while for the previous period it was -7.2%.

The daily graph of S&P 500 (click on it for a better view) shows that the market is getting close to an oversold area. What is more interesting is if it will be a bullish divergence formed on the graph. Still the general direction is down and a test of the 1093 area is possible.

What is more interesting is the bullish divergence that is already formed on the 1 hour graph of S&P 500 which could signal an upward movement for today at least to 1120/25 area. If that gets broken, the market could go higher to around 1140.

Tuesday, May 18, 2010

Euro/Dollar (EUR/USD) Technical Analysis - Daily, May 18, 2010

Euro/Dollar (EUR/USD) forex market is a nervous one today with many swings in both directions.
On the daily graph (click on the graph for a better view) we see the Euro tries to recover some of its loses against the Dollar from the past week but still the major trend is negative toward the Euro. Stochastic is directed upward so this explains to some part today's efforts of the Euro to gain strength.
On the 4 hour graph the Euro seems to have some more road to walk before gets in the overbought area. Now it trades around 23,6% Fibonacci retracement level from the last downward movement. It was for a while above it but that didn't last long and now it trades below it again.
On the smaller time-frames graphs there are multiple bearish divergences formed which could explain the nervousness of the market around current levels.
Still the bigger time-frame graphs look a bit positive for the Euro so it might try another test of 1.2430/40 area.

Monday, May 17, 2010

Euro/Dollar (EUR/USD) Technical Analysis - Daily, May 17, 2010

Click on the graphs for a better view.
 The daily picture looks interesting and while the major direction is still south for the Euro against the Dollar, the Stochastic shows that the EU currency is highly oversold. Still the MACD indicator hasn't made new lows but the Euro price has. This could turn to a bullish divergence which would signal the downfall is about to over.
Still if such a behavior takes place, it shouldn't be expected to happen overnight. The path upward would be hard and cumbersome. The MA on each of the major graphs are still negative and the trend is still down for the Euro.

During the day however there could be interesting opportunities on the buy side for the Euro. One of these was the fall to 1.2250/60 area which was quickly cleared and the direction went north.
On the 4 hour graph we see the Stochastic is pointing strongly upward so it could be expected the upward movement to last at least to around 1.2360 area and even a bit beyond.
The 1 hour graph is still not firmly on a positive side but the ones of a smaller time-frame are. Especially the 30 min one. So a possible scenario is to touch 1.2360/70 and stop for taking a breath.
Still the daily graph is not positive for the Euro so a buy Euro strategy remains a risky opportunity which stands on a shaky ground.

Euro/Dollar (EUR/USD) Technical Analysis - Weekly, 21 week, 2010

Click on the graph for a better view.
The glamor of the aid plan adopted by the EU quickly vanished last week and the Euro got to its lowest level against the US Dollar since the start of the current crisis.
Today it broke below the lowest point achieved around the failure of Lehman Brothers almost year and a half ago and currently trades around 1.2270/90 level.
The weekly graph still points downward but there are couple of things that should be considered.
The trading levels got steadily outside the Bollinger bands which usually is a sign of extremely high pressure. Such pressure is often found in the last moments of a particular movement. Moreover it almost trades at the Bollinger bands level on the Monthly graph but it still hasn't surpassed them.
Apart from the above notes the downside pressure for the Euro on the weekly graph still remains.
For a more precise picture the daily graphs should be checked during the week.

Sunday, May 16, 2010

Macro analysis on the US Dollar value - May, 2010

The current uptrend of the Dollar made many people talk about the possible failure of the EU zone, the parity between the Euro and the US Dollar and even brought ideas of Euro disappearing as a common European currency.
Let's see some figures.
The Trade balance of USA for the last 3 years (since the crisis began) shows that the periods of US Dollar gaining value are accompanied by decreases in the country's import and export of goods and services.

Plot this into the current Forex market conditions and the macro economic data from USA. Consider the following table of quarterly US GDP and EUR/USD (Euro/Dollar) graph (click on the graph for a better view).

Table 1 - USA GDP
14Net exports of goods and services2009 I  2009 II  2009 III  2009 IV  2010 I 
15   Exports-29.9-4.117.822.85.8
16      Goods-36.9-6.324.634.16.7
17      Services-13.60.15.62.63.8
18   Imports-36.4-14.721.315.88.9
19      Goods-41.0-16.525.120.39.0
20      Services-11.5-7.57.0-1.98.7

EUR/USD graph

The US Dollar for the last 5 months got near its highest levels since the start of the crisis and for the first quarter of 2010 the USA trade balance from the GDP table shows a lesser increase than the one marked for the previous quarter (in which the US Dollar was near its lowest level since the crisis start). Following this logic, the second quarter could prove identical or worse results.
An interesting conclusion from this comparison is that even with the higher value of the dollar the US economy was not able to achieve a higher growth of the money inflow to the country from foreign trade compared to the last quarter. So generally a weaker Dollar works better for the export/import businesses. Especially in a situation where the domestic consumption is not as strong as desirable.

Surely the strong Dollar is not the only obstacle in front of the USA sustainable growth. But in the current US economic policy of "easy money" it doesn't seem to please anyone but maybe the big petroleum companies which could have gained from both the increase of crude oil price and the increase of the Dollar value.

The current policy of FED has proved to be actively in favor of using monetary measures to expand consumer spending. There are no signs it will be changed in the near future. Basically this means pouring more money in order to stimulate spending relying mostly on the Keynes multiplier.

With all that said the current stock market and Forex market situation seems perfectly fit. A possible direction would be an increase of the available US Dollars on the market which will achieve two goals - stimulate (even if considered as being an artificial stimulation) domestic spending and bringing down the US Dollar value against the Euro (which happens to be the major currency it values against). The lesser value of the US Dollar would again increase the activities in foreign trades area and in turn would increase its share in the US GDP. As most of the major companies traded on the US stock exchanges are doing an international business this would reflect in possible increase of their financial results.

Tuesday, May 11, 2010

Euro/Dollar (EUR/USD) Technical Analysis - Daily, May 11, 2010

Click on the graph for a better view.

After the initial sharp increase of the Euro value yesterday, the US Dollar gained some ground and the day closed on the negative side for the Euro.
Today the Euro went lower at first and now it's gaining again some ground.
An interesting formation is seen on the 1 hour graph (and on the 30 min also). If Euro closes on the 1 hour graph above the 1.2745/50, there could be said a bullish divergence was formed which could lead the Euro higher.
On the 4 hour graph the Stochastic is in its lowest area and still the MACD and moving averages are not suggesting a prolonged decline of the Euro.
So basically as a short term way of playing the game the lower time-frame graphs should be watched and when (or if) they show a more clear indication for an Euro increase, this could be a good point for a long Euro position with a first target around the 1.28 level.

One should keep in mind that on the daily graph the Euro is still under pressure.

Monday, May 10, 2010

Euro/Dollar (EUR/USD) Technical Analysis - Daily, May 10, 2010

Click on the graphs for a better view.

The daily Euro/Dollar graph looks promising for the Euro but still now it is traded around its MA level. As the increase for today is quite big there is a possibility for a retreat to take place for some time.
Still the Stochastic is pointing strongly upward so any decrease in the value of Euro against the US Dollar should be easily covered.

The smaller time-frame graphs (the 4 hour and the 1 hour) are still positive for the Euro even though on the 1 hour graph there is a small bearish divergence seen which should be cleared out before the upward movement of the Euro has a chance to continue.

Having this in mind there is a chance in a very short term we see an increase for the US Dollar against the Euro. After that the graphs should be looked at again to see if that increase has a strength to continue and grow.

Euro/Dollar (EUR/USD) Technical Analysis - Weekly, 20 week, 2010

Click on the graph for a better view.

The news about the aid plan the EU government has agreed upon sent a big relief signal to the markets and the Euro jumped against the Dollar. It covered almost 5 cents of losses and currently trades at around 1.2930/40.
Technically there is a chance for a strong bullish Euro divergence to be formed on the weekly Euro/Dollar graph which could signal the start of another medium-term period of value decrease of the US Dollar.
Currently the Stochastic is pointing upward so this week could be a week of the Euro. Still the MACD is in a negative position so this should also be kept in mind.
If the expected increase of the Euro value takes place the first milestone is around 1.31 (a  level that was already touched today) which is the 23.6% Fibonacci retracement level. The second Euro resistance level after the first one lays around 1.34/35.

Friday, May 7, 2010

US stock market technical analysis - S&P 500, daily, 07052010

Click on the images for a better view.

The daily graph of S&P 500 (SPX) stock index shows the market being in a strong downtrend. Yesterday's plunge of about 10% was the reasonable result of series of days in which the market tried to compensate negative movements from the previous days. It wouldn't be much of a surprise if the big drop that took place almost in an hour was caused by automatic trading machines which triggered sell orders given the particular stop levels were reached.

Stochastic points a bit upward for today and in the pre-market the players tried to regain some of yesterday's loss of the S&P 500 index.
In a more close time-frame what is seen on the 4 hour graph of S&P 500 is that Stochastic is gaining height while still the value of the index stays bellow its previous heights. This could show us a possible attempt of the market to lift the index on the first time but as the MACD is still negative a further deeper decline after that attempt is possible. This comes in line with the Daily graph of the index.
Still the big picture looks considerably negative for the index and the stock market as a whole.
On the weekly graph there is a clear bearish divergence seen (shown by the blue lines).
The bullish divergence that took place almost a year ago pushed the markets to its recent heights but it looks now like being exhausted.
Should the bearish divergence takes the lead we could expect e deeper decline of the markets.

Euro/Dollar (EUR/USD) Technical Analysis - Daily, May 7, 2010

Click on the images for a better view.

After the big drop the Euro took yesterday, today is a day of regaining some strength. On the left daily EUR/USD graph we can see it managed to advance up to around 1.2750. Now it strives to get back inside the Bollinger bands. Stochastic is pointing up so we could witness an Euro day at least for the several hours. The reason for such movement could be seen on the lower time-frame graphs.
Still the bigger picture stays negative for the Euro concerning it US Dollar value.
On the 4 hour graph (which today shows almost the same patterns as the 1 hour) we see the Stochastic is pointing strongly upward. So up to its next measurement (which would be at 12 AM or after about 2 hours) the Euro could advance further against the US Dollar.
A possible level to be reached is the one marked with a horizontal red line on the graph - around 1.283/50. This is the 38.2 Fibonacci retracement level on the last big down movement of the Euro.

A warning sign could be seen on the smaller time-frame graphs (30 min and less) which until they are cleared, could make the market suffer a greater volatility.

Wednesday, May 5, 2010

Euro/Dollar (EUR/USD) Technical Analysis - Daily, May 5, 2010

The Euro took quite a plunge today with a loss of about a cent and a half. It started the day trading at about 1.2970/80 and currently trades at about 1.2815/20 US Dollar to one Euro.

As it can be seen on the Daily Eur/USD graph the resistance level around 1.30 (mentioned in the monthly Euro/Dollar technical analysis) was broken and now all the indicators are pointing south.
the graphs of the bigger timeframes agree with such a scenario so more surely than not the downfall of the Euro could be expected to continue for at least today and tomorrow.


On the smaller timeframe graphs the Euro looks oversold but as the bigger graphs are contrary to such a view, they could prevail. Nonetheless there could be times of revival of the Euro during the day so it might take a bit of breath before diving again.

Monday, May 3, 2010

EUR/USD Technical Analysis - Daily, May 3, 2010

Click on the images for a bigger view!

The daily Eur/Usd graph shows the Euro is still under pressure. It took a dive since the beginning of the day and was trading as low as 1.3205 US Dollars. After the intial shock it gained some ground and increased its value to around 1.3230/35. Still the daily graph doesn't support a strong day for the Euro.

In a shorter period there could be an advance of the Euro to cover about half of its today's loses. On the 1h graph we see there is a chance the Euro to achieve a level of about 1.3260 which happens to be both the MA30 and the 31.8 Fibonacci retracement level of the last week's Euro advance from 1.3114 to 1.3339.
Such a view is supported also by the 30min and 4h graphs.

EUR/USD Technical Analysis - Weekly, 19 week

The EUR/USD weekly graph for the current week doesn't show much of a lead.
In contrast to the upward movement of US Dollar during the second half of 2008, here we still don't see any clear trend turning divergence to be formed. The two red lines (A and B) shows the bullish divergence for the Euro which was followed by its own upward trend in the beginning of 2009.
What the current graph has is a MACD indicator whose Histogram is getting closer to being positive but the value of the Euro against the US Dollar still falls. This could indicate either an end of the fall or a stronger than expected downtrend for the Euro.
The Stochastic being in neither oversold or overbought area shows the current movements on the weekly graph are not supposed to be extremely strong and supported by a large amount in either of the directions.
With all that said what could be expected for the current week is a graduate continuation of the upward Dollar trend accompanied by many sideway movements. If we are getting closer to the end of the Euro fall a higher volatility could also be expected.

EUR/USD Technical Analysis - Monthly, May

The technical analysis picture on the EUR/USD monthly graph still looks depressing for the Euro. We are in the midst of a Dollar uptrend although there might be seen some signs for a change coming.
MACD is on the negative side and there seems more time will be needed till it goes positive. At the same time Stochastic shows the Euro is in the oversold area. The picture suggests that at least for the first days of May the Dollar will continue to grow stronger. As history shows there could be several months to pass before the trend gets definitely changed.

We could take a look at the monthly graph and expand it for a much longer period to see which are the possible resistance levels for the Dollar on its way up.
The horizontal red line shows the first possible Dollar resistance level against the Euro which lays at around 1.30.
As Euro looks being much oversold the most probable scenario looks a test of the 1.30 level and a bounce back.

Update: Markets reacted to the agreed bailout package of Greece with sending the Euro lower. In long term there is a chance Greece manages to recover and return the 110 billions of debt the EU and IMF decided to give her. As a result there will eventually be more quantity of money poured into the EU and IMF treasures. That however could take maybe 15-20 years to conclude. So the direct effect is diluting the Euro value and as a result the Dollar gets stronger.

Tuesday, April 27, 2010

EUR/USD Technical Analysis for 27.04.2010

The expected explosive increase of the Euro in the technical analysis from yesterday took place (as it is seen on the graph) and the EU currency gained about 0.8 cents to trade at about 1.3415 US Dollars. At that point a nice bearish MACD and Stochastic divergence was formed on the 4 hour graph so reasonably the Euro took its way down. This can be clearly seen on the graph on the left - shown by the red lines (click on the graph for a bigger view).
The daily EUR/USD graph (click on the graph for a bigger view) supports the view for a further incerease of the US Dollar against the Euro for today or even for the several days ahead. What we could witness is a test of the previous low of the Euro at around 1.32.

Monday, April 26, 2010

Dollar / Euro Technical Analysis

The Euro today is still under pressure while Greece is struggling to find its way out of the debt mess. There is a chance Germany will try to delay as long as possible the release of the first part of the money Greece needs. The date of the current debt payment by Greece is said to be May 19th so there are at most about 3 weeks of uncertainty ahead.


Technically the Euro has fallen almost enough. On the Monthly graph the EU currency seems more and more oversold. On the weekly though there is a chance for a further decline. Given the passed month of almost range trading (bound between 1.31 and 1.37) we shouldn't be surprised if there is another one like that to follow. But the drama comes near its end so a higher volatility shouldn't be a surprise.

The daily graph is somewhat contradictory as MACD is on the negative side for the Euro while Stochastic is pointing upward. The day started high for the Euro and later it lost almost a cent against the US Dollar. There is a chance for that cent to be recovered but the lower level graphs are still not so supportive.

In short term there are some bullish divergences seen on the graphs shorter than 1 hour and there is a chance for an explosive increase of the Euro value against the US Dollar especially after the Euro gets in oversold area on the 4 hour graph.

Friday, March 26, 2010

Financial Wisdom


It's a good thing to learn from other people's experience and wisdom. Often it's not so easy though. In investing and finances as in almost every other area of life we all learn best from our own mistakes. Unfortunately sometimes the price is too high.
Here is a collection of smart quotes we could learn from. The list will be updated from time to time.

  • "I often remind our analysts that 100% of the information you have about a company represents the past, and 100% of a stock's valuation depends on the future." Bill Miller

  • "Fourth Law of Motion: For investors as a whole, returns decrease as motion increases." Warren Buffet

  • It takes a man a long time to learn all the lessons of all his mistakes. They say there are two sides to everything. But there is only one side to the stock market; and it is not the bull side or the bear side, but the right side. J. Livermore

  • The speculator's chief enemies are always boring from within. It is inseparable from human nature to hope and to fear. Instead of hoping he must fear; instead of fearing he must hope. He must fear that his loss may develop into a much bigger loss, and hope that his profit may become a big profit. J. Livermore

All the above Livermore quotations are from the book "Reminiscences of A Stock Operator".

Wednesday, March 10, 2010

Hedging with options - a simple explanation


Hedging simply means an attempt to protect your investments from a loss.

There are cases in which you might want to stay in the market (or in your stock positions) even if you expect a short-term market movement against your holdings. In such times you might need to hedge your positions in order to protect your money (or investments). The reasons could vary - be it the simple will to escape taxation on short-term investments or if you are not sure enough if the profitable movement will continue and you want to lock some profit in.

Options are one of the most widely known tools for hedging. To put it simply the options give you ability to lock in the current price level of your holdings. For that protection you pay a price which usually is the current market price of the particular option.
  • If you own some stock and expect its price to decline for some time you can buy a PUT option. This strategy is known as "protective put" or "married put". Such PUT option will give you the right to sell the stock to the writer (seller) of the option at particular price (called the Strike price). In the case of hedging the point is that the strike price would be around the particular price that you want to hedge. Options are standardized contracts which trade by 100, i.e. one put option gives you right to sell 100 shares.

    An example:
    Let's say you own 500 shares of company XYZ. Their current market price is $15. You bought them at $10. So till now you have an unrealized profit of $2500 (not counting any commissions, etc). You can look at the options available for your stock and choose the PUT option whose strike price is closest to $15. Sometimes there could be only options for different prices - above and below your hedging price (the current market price of the stock). The option whose strike is above the stock market price (that option is called In-The-Money) will be more expensive than the PUT whose strike is below the current market price (the Out-Of-The-Money option). In that case you should choose what you prefer - to pay more and get even a better price than the current market price or pay less and wait for the option to get in the money. Let's say you get the out of the money Put whose strike is at $14 and is sold for $0.5 per option. As you own 500 shares of XYZ you would like to get 5 Put contracts which give you the right to sell 500 shares at $14. Those 5 options would cost you $250. So you give $250 and lock the $14 price level for your stock holdings. In the worst case (when the price goes below $14) you would limit your profit to 500 x 4 - 250 = $1750 and for a definite time (the time till the expiration date of the option) you will eliminate the risk of loss from a further decline in the stock price.
  • There is an exotic and more aggressive hedging against a short-term drop in the price of the underlying stock - shorting the Call options of the stock. The point is that usually (but not always!) the price of the In the Money Call whose strike is close to the current market price of the underlying stock tends to drop sharply if it goes out of the money.
    The possible profit (which will compensate your loss from the underlying stock) from such a strategy is limited by the price at which the call option is sold short minus the price at which you cover your short options position at a later time. A speculator could also profit from the leverage which options provide compared to the price of the stock itself.
    The loss on the other hand in this strategy could be unlimited if the price of the underlying stock starts to grow and you still have the short calls position opened. All that makes this a complicated and a risky strategy and thus not always suitable for simple hedging purposes.

    An example:
    If the current underlying price is $13, the price of a $12 strike call option could be $1.05. If you have 1000 shares you could sell short 10 such calls. That would get you $1050. On the next day or two the price of the underlying goes below the $12 limit and stops at $11.80. The loss from the underlying is $1200. The calls could be priced at $0.15. If you close the short position your profit from it would be $900. The whole loss on your investment goes to $1200 - $900 = $300. So by shorting the calls in this example your loss could be $300 and not $1200.
    On the other hand one could short a bigger amount of calls and thus even collect a profit at the end.

    Often the choice whether to use protective Puts or to short the Calls depends on the option's delta - that is how much the option's price would change if the price of the underlying stock experiences a change of $1. The deltas are constantly changing and could be checked on the CBOE site.
  • A nice strategy in which one could profit from a possible upward movement of a stock while still locking the current price level of the underlying is to simply buy an ATM Call and sell the shares owned. The money from the sell could be put in a risk-free investment. That way the current profit is "locked in" but the investor still would profit from a possible upward movement. The potential loss is limited to the amount of the premium paid for the option while the profit could equal the profit from the rise of the stock price plus the income from the risk-free investment.
Hedging with options is not so complicated as trading the options themselves but it still contains a higher level of risk and complexity. Options are not suitable for everyone and as they are more risky tool you should know what you do when you use them even if it's only for hedging of your current stock holdings. You are warned! :)

Below are some links about options:
Wikipedia
Shaeffer's Research
Options Basics: Introduction
Equity Option Strategies at CBOE

Tuesday, March 2, 2010

S&P 500 technical review

Financial markets could present us a series of sideway movements...

The S&P 500 index presents some interesting movements now. On the daily graph at the end of January there was a bullish divergence formed (the red lines on the graph below) that drove the value of the index to its current level. Now the index continues to climb. Still a break above its previous resistance level around 1150 (the horizontal blue line) doesn't seem very likely. There is a chance that we have a day or more of climbing but a bearish divergence starts to be appearing.

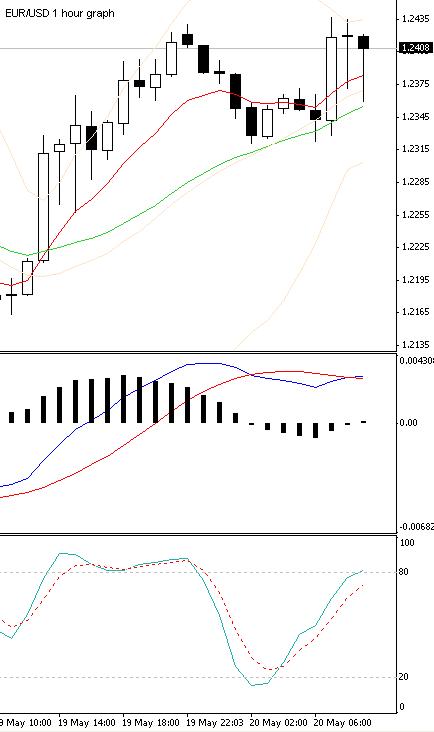
Apart from the possible bearish divergence the weekly graph shows that Stochastic has some more time to go north so this also supports the view that we might see some higher levels ahead. The other indicators keep the warning sign on and limit a possible upward movement as it can be seen on the graph below.

The monthly graph is the most interesting one today. What can be seen there is the nowadays situation looks very much like the one the index experienced in 2003. Even the indicators have quite similar form.

There's pretty much a chance for the things to repeat. That would mean a hard year filled with ups and downs with a breakage on the upside at the end. Although for the whole year we might see a retreat to at least 1068/60 where are the EMA30 and EMA9. Next level are around 1025/30. To put it simple - a range between 1025 - 1150 could be expected for the year ahead.