During the day the EURUSD pair has generally been up for the Euro with its value going twice to 1.3665. Still it was unable to break or even reach the barrier at 1.3680. But the more upward it goes the more favorable the risk/reward ratio seems measured toward that level. The longer time-frame graphs suggest there could be an upward movement of the US Dollar soon of roughly 100 pips or even more.
If entered on the sell side at the current level of 1.3645 with a stop at 1.3685 and a first target 1.3600, the risk/reward is slightly above 1 which is not very profitable. However the higher the pair goes toward 1.3670/80 area, the more profitable and less risky the R/R ratio gets.
Showing posts with label Daily. Show all posts
Showing posts with label Daily. Show all posts
Tuesday, February 8, 2011
Wednesday, February 2, 2011
EURUSD on the hour
The EURUSD pair ended the hour at 1.3778 - 50 pips below the possible entry level at 1.3830. Still there is some room for a fast drop to 1.3750 or even to 1.3730/20 (50% of the Fibo retracement). Depending on the client risk attitude the short USD trade could be closed now. Another strategy is to put a stop at 1.3780 in order to preserve the profits till now.
EURUSD Short-term possible trade
The upward movement of the Euro shows some signs of exhaustion and a possible retreat to 1.3750/60 could be formed. The European currency failed twice for the last hour to break above the 1.3845 level and there is a bearish hidden divergence formed on both the 15m i 30m graphs. An entry at the moment (at 1.3830) has a positive risk/reward ratio of 0.42 which translates to a twice bigger gains than the possible losses. An even more favorable entry could be formed at the 1.3845 level if the pair gets there again before dropping down.
Tuesday, February 1, 2011
EURUSD Short-term Technical Analysis
The technical EURUSD (Euro / USD) picture for the day and current situation (15min graph) is as follows:
 The 15 min graph shows the EURUSD pair is in the middle of its upward movement. The danger presented by the negative MACD values could be temporarily offset by the oversold condition (shown by the lower values of Stochastic at the moment). This could lead the pair to new highs above the previous high at 1.3836. The negative MACD however could signal the end of such upward movement and a fail to probe strongly that level would prove such possibility. At that point the Stochastic might well be in overbought condition and further ease the going down.
 The great danger to any continuation of the upward movement of the Euro are the negative MACD divergences seen on the 1h and 4h graphs. Still there is a space to go up and any down movement could be followed by a strong reversal.
Having in mind the above conditions a fall to at least 1.3790 is to be expected soon. Having that level broken, 1.3770 is the next target.
- main direction (daily) - Up (Euro rises as US Dollar falls)
- current situation - on the edge, possible reversal in the way following a last upward movement.


Having in mind the above conditions a fall to at least 1.3790 is to be expected soon. Having that level broken, 1.3770 is the next target.
Thursday, October 21, 2010
A Warning Sign for the Euro Bulls
The rise up of the Euro against the Dollar has been in place for the last months. Now the time for a change may be near. Take a look at the daily EUR/USD graph (click on it to see it big):
 Here we have a bit of a worring picture. The value of Euro has continued to rise despite the MACD recorded lower values. The Stochastic followed the MACD but still the MAs are on the positive side. That explains the volatile movements we are seeing these days. The Stochastic is pointing forward and the Euro rose again today. So far. The formation which is about to be formed is very worrisome for the Euro as there is a chance the power of the Euro Bulls that drives the increase of its value toward the Dollar to be vanishing.
The weekly graph still shows the Euro may has some time to go up but the Stochastic points it to be a bit overbought.
The more important warning sign is on the Monthly EURO/USD graph shown below:
 Here the MAs are still not on a positive side but still the Euro has risen a lot for the past months. What lights the red lamp is the Stochastic value which show the Dollar might be oversold. If that proves to be true we might witness another major rise of the Dollar in the next months. The situations requires attention and the conclusions might vary depending on the real data.

The weekly graph still shows the Euro may has some time to go up but the Stochastic points it to be a bit overbought.
The more important warning sign is on the Monthly EURO/USD graph shown below:

Thursday, July 29, 2010
Euro/Dollar (EUR/USD) Technical Analysis - Daily, July 29, 2010
The Euro/Dollar pair was in quite an uptrend for the last weeks. The graphs however show this could be close to an end. We examined the weekly graph in our weekly technical analisys and now the Daily one looks promising.
 The Daily Euro/Dollar graph (click on it for a better view) shows the pair was making new highs for the last several weeks while the MACD continued to make lower highs. Now its even on the negative side. The Stochastic shows the Euro is now in the overbought area.
The bearish MACD divergence combined with the overbought condition could trigger pretty soon selling of the Euro after all the buying power gets too exhausted.
A possible trigger for such a movement could be any of the news expected today - the Unemployment change in Germany, the Economic confidence in EU, M4 Money supply in UK or the Jobless claims in USA. One may follow these news (and even more) in our Economic calendar .
Wednesday, June 9, 2010
US stock market short-term update - technical, S&P 500, 09062010
The futures trading shows some of the strength of the bulls might be vanishing so one should beware.
 What is formed on the 4 hour graph is a hidden divergence between the S&P 500 (SPX) index and the Stochastic indicator which could signal a retreat for the index at least in short term. There are several hours to pass before the opening of the market so these could be bears' hours.
On the smaller time-frame graphs the down direction is even more visible. On the 1 hour and 30 min there is still more time to pass before the down movement is finished.

On the smaller time-frame graphs the down direction is even more visible. On the 1 hour and 30 min there is still more time to pass before the down movement is finished.
US stock market technical analysis - S&P 500, daily, 09062010
US stock market has fallen a lot. What started as a surprise to many of the players at the beginning of May continued during the whole month and now the S&P 500 index has reached one of its lowest levels for the period. The signs of the current fall were visible even in April when a series of bearish divergences were formed on the daily and weekly graphs and our expectations of a fall of the markets proved to be right. That downfall was striking to many people and now as they have fresh memories of the pains they might have taken during last 3 years, they are now more scared than ever. Suddenly almost everybody turned bearish which explains the striking volatility and sharp downfalls of the indices. But this means also one more thing - there could not be much more fuel to the inertia. And the rising of the markets could surprise at least as many people as did the sudden decrease of the indices. So much for the psychology. :)
What we see today on the daily graph might pretty much mean the bulls might take some control now.
 The graph shows the index continues to make new lows but the indicators don't follow. For today the S&P 500 grew and the Stochastic shows it being in an oversold condition. Still the MAs show the index is in a negative area but those divergences could lead to an increase. Still for a long-term bullish view, this bullish divergence better be confirmed by the MAs crossing on the upside.
The weekly graph shows the index is in a downtrend but a warning sign for the bears (and a good news to the few bulls) is that on the monthly graph the index still hasn't crossed that line and is in an uptrend. There is also no MACD bearish divergence there.

Despite the uncertainty if the index will change its down trend now for the long term, the 4 hour graph shows that for tomorrow there's a big chance the increase to continue. What we see here is the bullish divergence is seen in two indicators which could definitely lead to a continuation of the increase. Around 1068-72 level could be some resistance and if that gets broken, the way up to 1100 seems open.
What we see today on the daily graph might pretty much mean the bulls might take some control now.

The weekly graph shows the index is in a downtrend but a warning sign for the bears (and a good news to the few bulls) is that on the monthly graph the index still hasn't crossed that line and is in an uptrend. There is also no MACD bearish divergence there.

Despite the uncertainty if the index will change its down trend now for the long term, the 4 hour graph shows that for tomorrow there's a big chance the increase to continue. What we see here is the bullish divergence is seen in two indicators which could definitely lead to a continuation of the increase. Around 1068-72 level could be some resistance and if that gets broken, the way up to 1100 seems open.
Wednesday, May 26, 2010
Euro/Dollar (EUR/USD) Technical Analysis - Daily, May 26, 2010
After yesterday's closing of the Euro/Dollar pair near to its open level, today's trade started lower. However the technical analysis shows the direction might change during the day.
 The daily graph of EUR/USD (click on it for a better view) shows the Euro gets close to being oversold while the MACD histogram is positive. Still the Stochastic points down but the formation looks promising for an Euro advance. Let's check the lower time-frame graphs.
 On the 1 hour graph of Euro/Dollar we see the pair is swinging around the Moving Averages. Still the MAs are positive and the Stochastic points strongly upward. This could lead to at least a short term advance of the Euro against the US Dollar with target placed at the previous high around 1.2380/90.
The overall risk of further decline of the Euro still stays on the bigger time-frame graphs.


The overall risk of further decline of the Euro still stays on the bigger time-frame graphs.
Wednesday, May 19, 2010
US stock market technical analysis - S&P 500, daily, 18052010
The US markets have fallen a lot since the last technical analysis. Today the US Consumer Price Index (CPI) level is expected to be announced. The consensus figures are 0.1 (MoM) and 2.4 (YoY). Earlier in the day the Construction Output in the European Monetary Union (EMU) was declared to be 7.6% while for the previous period it was -7.2%.
 The daily graph of S&P 500 (click on it for a better view) shows that the market is getting close to an oversold area. What is more interesting is if it will be a bullish divergence formed on the graph. Still the general direction is down and a test of the 1093 area is possible.
 What is more interesting is the bullish divergence that is already formed on the 1 hour graph of S&P 500 which could signal an upward movement for today at least to 1120/25 area. If that gets broken, the market could go higher to around 1140.


Tuesday, May 18, 2010
Euro/Dollar (EUR/USD) Technical Analysis - Daily, May 18, 2010
Euro/Dollar (EUR/USD) forex market is a nervous one today with many swings in both directions.
 On the daily graph (click on the graph for a better view) we see the Euro tries to recover some of its loses against the Dollar from the past week but still the major trend is negative toward the Euro. Stochastic is directed upward so this explains to some part today's efforts of the Euro to gain strength.
 On the 4 hour graph the Euro seems to have some more road to walk before gets in the overbought area. Now it trades around 23,6% Fibonacci retracement level from the last downward movement. It was for a while above it but that didn't last long and now it trades below it again.
On the smaller time-frames graphs there are multiple bearish divergences formed which could explain the nervousness of the market around current levels.
Still the bigger time-frame graphs look a bit positive for the Euro so it might try another test of 1.2430/40 area.


On the smaller time-frames graphs there are multiple bearish divergences formed which could explain the nervousness of the market around current levels.
Still the bigger time-frame graphs look a bit positive for the Euro so it might try another test of 1.2430/40 area.
Monday, May 17, 2010
Euro/Dollar (EUR/USD) Technical Analysis - Daily, May 17, 2010
Click on the graphs for a better view.
 The daily picture looks interesting and while the major direction is still south for the Euro against the Dollar, the Stochastic shows that the EU currency is highly oversold. Still the MACD indicator hasn't made new lows but the Euro price has. This could turn to a bullish divergence which would signal the downfall is about to over.
Still if such a behavior takes place, it shouldn't be expected to happen overnight. The path upward would be hard and cumbersome. The MA on each of the major graphs are still negative and the trend is still down for the Euro.
During the day however there could be interesting opportunities on the buy side for the Euro. One of these was the fall to 1.2250/60 area which was quickly cleared and the direction went north.
 On the 4 hour graph we see the Stochastic is pointing strongly upward so it could be expected the upward movement to last at least to around 1.2360 area and even a bit beyond.
The 1 hour graph is still not firmly on a positive side but the ones of a smaller time-frame are. Especially the 30 min one. So a possible scenario is to touch 1.2360/70 and stop for taking a breath.
Still the daily graph is not positive for the Euro so a buy Euro strategy remains a risky opportunity which stands on a shaky ground.

Still if such a behavior takes place, it shouldn't be expected to happen overnight. The path upward would be hard and cumbersome. The MA on each of the major graphs are still negative and the trend is still down for the Euro.
During the day however there could be interesting opportunities on the buy side for the Euro. One of these was the fall to 1.2250/60 area which was quickly cleared and the direction went north.

The 1 hour graph is still not firmly on a positive side but the ones of a smaller time-frame are. Especially the 30 min one. So a possible scenario is to touch 1.2360/70 and stop for taking a breath.
Still the daily graph is not positive for the Euro so a buy Euro strategy remains a risky opportunity which stands on a shaky ground.
Tuesday, May 11, 2010
Euro/Dollar (EUR/USD) Technical Analysis - Daily, May 11, 2010
Click on the graph for a better view.
 After the initial sharp increase of the Euro value yesterday, the US Dollar gained some ground and the day closed on the negative side for the Euro.
Today the Euro went lower at first and now it's gaining again some ground.
An interesting formation is seen on the 1 hour graph (and on the 30 min also). If Euro closes on the 1 hour graph above the 1.2745/50, there could be said a bullish divergence was formed which could lead the Euro higher.
On the 4 hour graph the Stochastic is in its lowest area and still the MACD and moving averages are not suggesting a prolonged decline of the Euro.
So basically as a short term way of playing the game the lower time-frame graphs should be watched and when (or if) they show a more clear indication for an Euro increase, this could be a good point for a long Euro position with a first target around the 1.28 level.
One should keep in mind that on the daily graph the Euro is still under pressure.
Monday, May 10, 2010
Euro/Dollar (EUR/USD) Technical Analysis - Daily, May 10, 2010
Click on the graphs for a better view.
 The daily Euro/Dollar graph looks promising for the Euro but still now it is traded around its MA level. As the increase for today is quite big there is a possibility for a retreat to take place for some time.
Still the Stochastic is pointing strongly upward so any decrease in the value of Euro against the US Dollar should be easily covered.

The smaller time-frame graphs (the 4 hour and the 1 hour) are still positive for the Euro even though on the 1 hour graph there is a small bearish divergence seen which should be cleared out before the upward movement of the Euro has a chance to continue.
Having this in mind there is a chance in a very short term we see an increase for the US Dollar against the Euro. After that the graphs should be looked at again to see if that increase has a strength to continue and grow.
Friday, May 7, 2010
US stock market technical analysis - S&P 500, daily, 07052010
Click on the images for a better view.
The daily graph of S&P 500 (SPX) stock index shows the market being in a strong downtrend. Yesterday's plunge of about 10% was the reasonable result of series of days in which the market tried to compensate negative movements from the previous days. It wouldn't be much of a surprise if the big drop that took place almost in an hour was caused by automatic trading machines which triggered sell orders given the particular stop levels were reached.
Stochastic points a bit upward for today and in the pre-market the players tried to regain some of yesterday's loss of the S&P 500 index. In a more close time-frame what is seen on the 4 hour graph of S&P 500 is that Stochastic is gaining height while still the value of the index stays bellow its previous heights. This could show us a possible attempt of the market to lift the index on the first time but as the MACD is still negative a further deeper decline after that attempt is possible. This comes in line with the Daily graph of the index.
 Still the big picture looks considerably negative for the index and the stock market as a whole.
On the weekly graph there is a clear bearish divergence seen (shown by the blue lines).
The bullish divergence that took place almost a year ago pushed the markets to its recent heights but it looks now like being exhausted.
Should the bearish divergence takes the lead we could expect e deeper decline of the markets.
The daily graph of S&P 500 (SPX) stock index shows the market being in a strong downtrend. Yesterday's plunge of about 10% was the reasonable result of series of days in which the market tried to compensate negative movements from the previous days. It wouldn't be much of a surprise if the big drop that took place almost in an hour was caused by automatic trading machines which triggered sell orders given the particular stop levels were reached.

Stochastic points a bit upward for today and in the pre-market the players tried to regain some of yesterday's loss of the S&P 500 index.


On the weekly graph there is a clear bearish divergence seen (shown by the blue lines).
The bullish divergence that took place almost a year ago pushed the markets to its recent heights but it looks now like being exhausted.
Should the bearish divergence takes the lead we could expect e deeper decline of the markets.
Euro/Dollar (EUR/USD) Technical Analysis - Daily, May 7, 2010
Click on the images for a better view.
 After the big drop the Euro took yesterday, today is a day of regaining some strength. On the left daily EUR/USD graph we can see it managed to advance up to around 1.2750. Now it strives to get back inside the Bollinger bands. Stochastic is pointing up so we could witness an Euro day at least for the several hours. The reason for such movement could be seen on the lower time-frame graphs.
Still the bigger picture stays negative for the Euro concerning it US Dollar value.
 On the 4 hour graph (which today shows almost the same patterns as the 1 hour) we see the Stochastic is pointing strongly upward. So up to its next measurement (which would be at 12 AM or after about 2 hours) the Euro could advance further against the US Dollar.
A possible level to be reached is the one marked with a horizontal red line on the graph - around 1.283/50. This is the 38.2 Fibonacci retracement level on the last big down movement of the Euro.
A warning sign could be seen on the smaller time-frame graphs (30 min and less) which until they are cleared, could make the market suffer a greater volatility.

Still the bigger picture stays negative for the Euro concerning it US Dollar value.
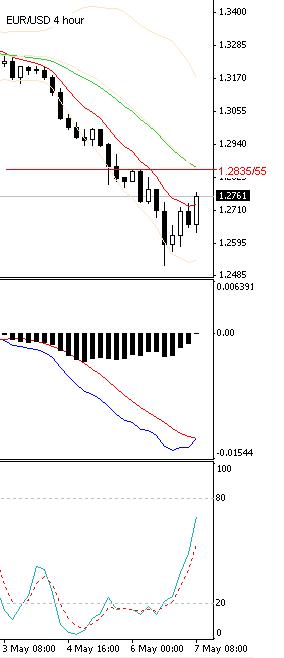
A possible level to be reached is the one marked with a horizontal red line on the graph - around 1.283/50. This is the 38.2 Fibonacci retracement level on the last big down movement of the Euro.
A warning sign could be seen on the smaller time-frame graphs (30 min and less) which until they are cleared, could make the market suffer a greater volatility.
Wednesday, May 5, 2010
Euro/Dollar (EUR/USD) Technical Analysis - Daily, May 5, 2010
The Euro took quite a plunge today with a loss of about a cent and a half. It started the day trading at about 1.2970/80 and currently trades at about 1.2815/20 US Dollar to one Euro.
 As it can be seen on the Daily Eur/USD graph the resistance level around 1.30 (mentioned in the monthly Euro/Dollar technical analysis) was broken and now all the indicators are pointing south.
the graphs of the bigger timeframes agree with such a scenario so more surely than not the downfall of the Euro could be expected to continue for at least today and tomorrow.
 On the smaller timeframe graphs the Euro looks oversold but as the bigger graphs are contrary to such a view, they could prevail. Nonetheless there could be times of revival of the Euro during the day so it might take a bit of breath before diving again.

the graphs of the bigger timeframes agree with such a scenario so more surely than not the downfall of the Euro could be expected to continue for at least today and tomorrow.

Monday, May 3, 2010
EUR/USD Technical Analysis - Daily, May 3, 2010
Click on the images for a bigger view!
 The daily Eur/Usd graph shows the Euro is still under pressure. It took a dive since the beginning of the day and was trading as low as 1.3205 US Dollars. After the intial shock it gained some ground and increased its value to around 1.3230/35. Still the daily graph doesn't support a strong day for the Euro.
 In a shorter period there could be an advance of the Euro to cover about half of its today's loses. On the 1h graph we see there is a chance the Euro to achieve a level of about 1.3260 which happens to be both the MA30 and the 31.8 Fibonacci retracement level of the last week's Euro advance from 1.3114 to 1.3339.
Such a view is supported also by the 30min and 4h graphs.


Such a view is supported also by the 30min and 4h graphs.
Tuesday, April 27, 2010
EUR/USD Technical Analysis for 27.04.2010


Monday, April 26, 2010
Dollar / Euro Technical Analysis
The Euro today is still under pressure while Greece is struggling to find its way out of the debt mess. There is a chance Germany will try to delay as long as possible the release of the first part of the money Greece needs. The date of the current debt payment by Greece is said to be May 19th so there are at most about 3 weeks of uncertainty ahead.

Technically the Euro has fallen almost enough. On the Monthly graph the EU currency seems more and more oversold. On the weekly though there is a chance for a further decline. Given the passed month of almost range trading (bound between 1.31 and 1.37) we shouldn't be surprised if there is another one like that to follow. But the drama comes near its end so a higher volatility shouldn't be a surprise.
The daily graph is somewhat contradictory as MACD is on the negative side for the Euro while Stochastic is pointing upward. The day started high for the Euro and later it lost almost a cent against the US Dollar. There is a chance for that cent to be recovered but the lower level graphs are still not so supportive.
 In short term there are some bullish divergences seen on the graphs shorter than 1 hour and there is a chance for an explosive increase of the Euro value against the US Dollar especially after the Euro gets in oversold area on the 4 hour graph.

Technically the Euro has fallen almost enough. On the Monthly graph the EU currency seems more and more oversold. On the weekly though there is a chance for a further decline. Given the passed month of almost range trading (bound between 1.31 and 1.37) we shouldn't be surprised if there is another one like that to follow. But the drama comes near its end so a higher volatility shouldn't be a surprise.
The daily graph is somewhat contradictory as MACD is on the negative side for the Euro while Stochastic is pointing upward. The day started high for the Euro and later it lost almost a cent against the US Dollar. There is a chance for that cent to be recovered but the lower level graphs are still not so supportive.

Subscribe to:
Posts (Atom)