Share It

Share |

Tuesday, December 22, 2009

Ford (F) Technical View - a Warning Sign?

The graphs of Ford (F) take quite a different shape than that of other major companies. Take a look at the monthly graph:
The highest levels of Ford stock price were achieved during 1999-2000 while for the majority of other stocks the highest levels occured before the last bump at 2007. What I see interesting at this graph is that now the price is on an important level - the one that played resistance twice back at 1988-1990 and again at 2007-2008. There lies the Moving average (100) too.

It's no secret the company has its strong sides like innovative auto lines, good management, nice public reviews, etc. There could be issues with the debt levels but as the Macro conditions improve those should not lead to any significant problems.Still this level of $10-12 could play the role of strong resistance for a while.
The reasons for such thinking might be seen in the next graphs although they might need some time to develope more sure patterns.

On the weekly graph we see the price making new highs while the MACD fails to make such. The Stochastic is in its overbought area but still hasn't turned down. So there might be some more time for goind up but the MACD divergence should be weighting even more. This view is supported by the fact that on the daily graph the situation looks pretty the same.

Having all that said it might not be a bad idea to watch the graphs in the next few days to see if they will develop any clearer patterns.

Monday, December 21, 2009

EUR / USD Technical View - Strong support for the Dollar?

On Nov. 17 I wrote an article about the negative correlation between the dollar and the stocks. About 2 weeks later the dollar started its victorious march and the stocks didn't follow. The macro conditions about such a movement were clear. Let's take a look at some graphics now.

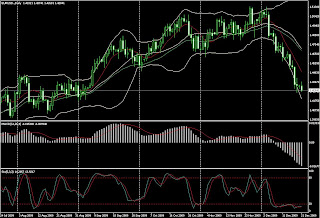
The monthly graph shows a clear down path for the Euro. Although the MACD is on a positive side, the Stochastic is strongly pointing down. There is a bearish divergence between the Stochastic and the price. The Moving averages are not so strongly bullish about the Euro. All this could lead to a fall of Euro to around 1.3650-1.37 - a resistance level for the first upside movement of Euro at Aug 2004. This level is also 50% decrease from the last upside movement. This may seem like a bold view but the other graphics seem to support it.

The weekly graph shows the bearish Stochastic divergence (we have higher levels of Euro and lower highs of the Stochastic) even more clearly. The Moving averages still haven't crossed on the downside but there is still more the Stochastic to go. It is close to the oversold level but still not there. The daily graph shows more.

On the daily graph the MACD is strongly negative. The Stochastic is strongly oversold. There could be some retractions to higher levels of Euro but with such a negative MACD the dollar positions seem stronger for now. With the support from the graphs of the higher time-frames, the path seems only one way. Till it gets on or close to the above mentioned levels.

Thursday, December 17, 2009

Citi offering priced at $3.15

Yesterday (Wednesday) Citi put a sell offer at $3.15, ten cents bellow the price at which the government bought their shares. A smart move that temporarily eliminated the danger of unexpected sell of more than 5 billion shares from the government. The price paid by the bank is that it has to sell more shares at that price to get the desired 17 billion dollars.
At least now we know the shares sold the last 3 days were not from the government. About 3 billion shares changed hands. Maybe some of them were shorts but whatever the case someone bought that quantity.
Interesting point now is to see who will enter as a shareholder in Citi. The quantity offered is about 23% of the current shares outstanding which is quite a big percentage.

The technical picture hasn't changed much from yesterday's view of the chart. The things are still pointing downward. And in the aftermarket the level of $3.2 was touched. We could see a spike to $3.15 and even some bellow but the stock is becoming to look more and more oversold.

Sofix daily review

A simple view about the Bulgarian stock exchange index movement.

The levels where the index is these days
are just the 38.2% Fibonacci retracement level for the whole upside movement from 257.65 achieved on 24.02.2009 to 514.67 made on 17.09.2009 (shown by the two red lines on the graph). The RSI is in
its low but MACD still points downward. Still the MACD hasn't go as low as it was on the previous down attempt at the beginning of November. If the Fibo level (412 - 416) is not broken wild there is a
chance to see a recovery soon. If it gets penetrated the next stop could be found at 370-385.

Wednesday, December 16, 2009

Citi daily review

The news about paying back the TARP money unleashed the selling pressure on the bank stock and the price fell bellow the support level of 3.80-84. One of the questions now is if the stocks being sold are from the 5 billion the government decided to sell. Still the government officials said they expect 13-14 billions profit from their investment in Citi. With about 7.7 billions of stocks such profit comes to an average increase in the price between $1.68 and $1.81 from the initial conversion price which was $3.25. If we accept that the government selling started after the news about paying the TARP was published this makes the best selling price at about $3.80. If the whole number of shares were to be sold at that price, which they were not because the total turnover volume didn't exceed a billion, the profit would be about $2.75 billions. So the gap of about $10 billions between that figure and the whole profit the government expects shoud be filled from somewhere. Or they could be possibly wrong in their expectations... With the government being left with about $2 billions of stocks, a profit of $10 billions goes to a price increase of about $5 from their initial price. So continuing this line of thought they could be expecting in the next 6 to 12 months a price of about $8 for the Citi stocks.
An interesting thing to mention is that Citi hasn't issued yet a price at which it will try to get its new shares sold in order to pay the remaining part of TARP. A reasonable thinking is that it waits to see where the price will be after the government ended with their selling. Another reasonable thinking might be that Citi needs a price as high as available because this will let it sell less shares. On the other hand the bank might not be in position to be able to "negotiate" a price at that deep level.

The above are just some thoughts derived from the movements and news on the market.. A hypothesis which could be right or wrong, the time will tell.

The technical daily view of the stock.
The price fell bellow the support level of $3.80. The volume of the last two days grows and the price falls accordingly. MACD points downward, Stochastic also. Today we could witness another fall. The next support level is around 3.30-20.

Thursday, December 10, 2009

Citi technical overview


The short interest shares of Citi as of Nov 30 2009 are 215,990,623. At Nov 13 2009 they were 194,829,624. The average daily volume for the both dates are 236,804,540 and 340,175,866. We see an increase in the shorts as well as a bigger decrease in the average daily volume of the stock. So the sentiment towards the stock turns to be more negative.
The significant jump in the share's price that took place at August comes just after the Sold short shares thumbled from more than 1.2 billions to just about 300 millions.
Now we don't see so big amount of short sales so the fuel for a price advance (if any) should come from somewhere else.


As it is seen on this daily graph the recent news flow about the company is more intense than anytime in the past 3 months. The price falls. An interesting thing is the price is on a short-term support level and Stochastic is in the oversold area. But it is still pointing down. So the negative sentiment might be growing but soon we could see its end. At least in a short term.

 
On the weekly graph however we see a sort of sideway motion. Around the support line and currently beneath it. Still MACD is around zero and Stochastic pointing downward. The best scenario for bulls could be the price to form some positive MACD divergence but such one could take several weeks to arrive.

Tuesday, November 17, 2009

Stocks and the Dollar - will the negative correlation break?


I think it's quite possible.
The time of this breakage is questionable though. But all the ingredients seem to be in place. The government officials speak more often about a stronger dollar. The last Bernanke remarks are just in line. About half a month ago the president Obama spoke on a meeting with an advisory board about the fact that America has to find a way to sustain growth without so much debt. Last week US Treasury Secretary spoke about the same strong dollar topic in Japan.

But the officials are just the surface, I believe. They prepare the public and the markets. The real reasons could be drilled down to a simple "demand & supply".

The more quantity you have of something, the more cheaper it is. With all those trillions of Dollars poured into the system (mainly as M1 money! which means the real amount of money expected to reach the public is multiplied by some figure) it's no suprise the dollar is cheap. Yes, there are more complicated connections in the market but the bottom line stays the same. Remember the times when Central banks occasionally were starting to buy their own currencies in order to lift their price? Things might have not changed so much...

There are at least two ways to decrease the supply of dollars - increasing the base interest rate of FED and getting back at least a part of the dollars put in the system. Leave aside all the demand for dollars that might be generated from the market.

For the last several years the stronger the dollar went, the lower the US stocks fell. This has something to do with the notion that the cheaper the dollar is, the more U.S. export there is and that stimulates the U.S. companies. But this might no longer be the case. Because no matter how cheap you sell, you have to sell to anyone. And when the world demand simply vanished, the cheaper you sell, the more you lose.

Add to this the prices of oil which closely reflects the movement of the dollar. Since March 2009 the dollar has lost about 18% of its value against the Euro. The crude oil more than doubled for the same period. This could be one of the main reason why the US officials want a stronger dollar. No matter how big are their oil companies and how much they export, they can't fill the gap and the damage the high oil price does to the America's economy.

The macro needs seem to come first and before the needs of the financial system now. Especially when that system is sort of stabilized. That explains all the talks about alternative energy sources and the eco economy. But to develop such economy takes time. The one thing that could give America the needed time happens to be a stronger dollar. Yes, maybe most of the near-time future profits of export oriented companies (which happens to be most of the big companies on U.S. stock exchanges) will suffer a decrease but this could be a sacrifice needed.

The last point is when the stocks and the dollar start to move more or less in the same direction. Or at least in not so heavy negative correlation. Aroung and above zero could be the best :) But this seems to be a tough task. It will take time for sure.

Thursday, October 22, 2009

"Bullish markets climb a wall of worry"

A little quick technical overview of the S&P500.

For over a month more and more people are expecting the index to turn down and still it continues to go up with some sideways in the way.

The bullish divergence noticed in the Bear trap post from March 2009 resulted in a very strong movement upward.
The outer noise seems quite irritating now and we hear and read about contradicting expectations in all the media. This seems like a clear example of the saying that "Bullish markets climb a wall of worry". :)

So let's see some graphs.


This is a monthly graph of S&P 500 (SPX) for a period of about 10 years. The red line shows some possible resistance levels. That is about 1175-1200. At that point the markets have had resistance points two times - at the first half of 2002 and again in 2004. The same levels have played the role of support points in 2001 and 2005. This alone should speak of the importance of this level range.
The second issue with these figures is that there lies the EMA 50 on the monthly graph.
The third interesting thing we see on this graph is the slow Stochastic which shows the market gets sort of overbought. Still the MACD is right about to go into the positive side. Time will tell if this deserves a better attention.


The weekly graph confirms the current movement may still have some way to go upward. The stochastic is pointing up, but the MACD is making lower highs while the index continues to make higher highs. It is interesting how this will unroll because it could be either a hidden divergence confirming the upward trend or a real divergence which will show the trend is about to turn.


The more closer look (the daily graph) explains the current ups and downs and why there could be some pressure for a downside movement in the short run. At least to the EMA 50 which is about 1045-50.

Time will tell if these thoughts are right.

Tuesday, March 3, 2009

DOW and SPX 500 new lows - a short-term bear trap?

The moods of the markets have suddenly changed. All over the medias we see aticles how the November lows of the S&P 500 and DOW JONES are broken and the road to the worst bear market is now open. Maybe this is right.. and maybe not so much.
At least in a short time.

Explanation follows :)

On the daily graph the market seems oversold. It has broken its lowest November levels, moreover it has gone below the lows of 2002-2003 year. This alone seems bad enough for all the filled-with-hope people to run out of the markets selling their stakes and even taking short positions. Now they are hoping again, only the hope is to profit from the downward movement.


The same oversold condition we see on the weekly graph. With stochastic being this low we could expect the strenght of the down movement to start to vanish. The next stop could be found around 630-680 - levels not seen from 1997-98. The inertion could put the market to that point but will such a slide have a power to continue?
What could happen is to be formed a real bullish MACD divergence. The lower the market goes with not having the indicator breaking its own November low, the stronger the chances for a rally. With the negative sentiment and more and more lower expectations there is a chance to witness at least a short term bull's rally. One that could bring the indexes to "hopefull" levels again.


Having all this said the main movement I still believe the American market has to make is deep downward. Such expectation is driven from the monthly graph where there is a real bearish MACD divergence formed on a very big time frame. Such a divergence could not be cleared with simply going to lows which are "in the middle of nowhere" (in this case the middle of the timeframe of the divergence). Moreover the MACD on the monthly graph is around half the way of its own down movement. If we change the timeframe to "Quarterly" - the picture gets even more clear.

All this are just thoughts written to test their accuracy in time. Trying to predict the market has proven to be a bad idea. But following the crowd seems worse. :)

Wednesday, January 14, 2009

sofix daily


After the start of the biggest till now fall in the history of the Bulgarian most widely followed index SOFIX it has lost more than 82% of its value. The highest point achieved was 1981.8 form the first week of October 2007. Yesterday it closed at 346.87. We now have more than a year of almost uninterrupted downtrend.
Many people might have expected the new year to start with new hights. The volume traded provided no such evidence. Moreover as can be seen on the above picture, there could be a hidden divergence on the daily graph of SOFIX. This might mean that the will to go higher has no power to support the growth. On the weekly graph the trend still points south so bearing in mind the divergence we might see the previous low of 319 been broken. The next stop from there is around 220-260 where could be seen a single stop in the uptrend in the early year 2003.
The surprise of the short-horizon people (mainly speculators who hoped to sell after a minimum amount of time) from the falling index might lead to a new wave of extensive sell and backing off of the buyers.