On Nov. 17 I wrote an article
about the negative correlation between the dollar and the stocks. About 2 weeks later the dollar started its victorious march and the stocks didn't follow. The macro conditions about such a movement were clear. Let's take a look at some graphics now.

The monthly graph shows a clear down path for the Euro. Although the MACD is on a positive side, the Stochastic is strongly pointing down. There is a bearish divergence between the Stochastic and the price. The Moving averages are not so strongly bullish about the Euro. All this could lead to a fall of Euro to around 1.3650-1.37 - a resistance level for the first upside movement of Euro at Aug 2004. This level is also 50% decrease from the last upside movement. This may seem like a bold view but the other graphics seem to support it.

The weekly graph shows the bearish Stochastic divergence (we have higher levels of Euro and lower highs of the Stochastic) even more clearly. The Moving averages still haven't crossed on the downside but there is still more the Stochastic to go. It is close to the oversold level but still not there. The daily graph shows more.

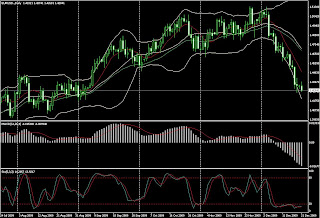
On the daily graph the MACD is strongly negative. The Stochastic is strongly oversold. There could be some retractions to higher levels of Euro but with such a negative MACD the dollar positions seem stronger for now. With the support from the graphs of the higher time-frames, the path seems only one way. Till it gets on or close to the above mentioned levels.
 The monthly graph shows a clear down path for the Euro. Although the MACD is on a positive side, the Stochastic is strongly pointing down. There is a bearish divergence between the Stochastic and the price. The Moving averages are not so strongly bullish about the Euro. All this could lead to a fall of Euro to around 1.3650-1.37 - a resistance level for the first upside movement of Euro at Aug 2004. This level is also 50% decrease from the last upside movement. This may seem like a bold view but the other graphics seem to support it.
 The weekly graph shows the bearish Stochastic divergence (we have higher levels of Euro and lower highs of the Stochastic) even more clearly. The Moving averages still haven't crossed on the downside but there is still more the Stochastic to go. It is close to the oversold level but still not there. The daily graph shows more.
 On the daily graph the MACD is strongly negative. The Stochastic is strongly oversold. There could be some retractions to higher levels of Euro but with such a negative MACD the dollar positions seem stronger for now. With the support from the graphs of the higher time-frames, the path seems only one way. Till it gets on or close to the above mentioned levels.
No comments:
Post a Comment